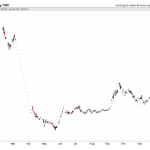
The year 2000 was a significant turning point in the history of silver prices and the US federal budget. During this time, the daily prices of silver fluctuated between $4.93 oz to $5.02 oz in June and July, before gradually declining to $4.58 oz by December.
While President Clinton’s federal budget proposals for fiscal year 2001 aimed to reduce national debt and increase social spending, cash accounting tricks were used to mask the true extent of federal government liabilities. Today, the federal budget has more than doubled, and the total federal debt is nearly four times what it was in 2000.
This article aims to explore the historical data of silver prices in 2000 and its correlation with the US federal debt. By analyzing the trends and patterns of silver prices during this time, we can gain a better understanding of the factors that contributed to its fluctuations, and how these factors impacted the federal budget.
Additionally, we will examine the impact of these events on real wages, and how they shaped the economic landscape of the United States in the early 2000s. Through this analysis, we hope to provide a comprehensive overview of the relationship between silver prices and federal debt in 2000 and their lasting effects on the US economy.
Silver Price History
The historical data and charts available on the live Silver Price page provide a comprehensive overview of the silver market trends from 1968 to 2021.
The LBMA silver price fix history data, which reflects the composite prices arrived at by various trading banks and brokerages in the over-the-counter silver bullion markets, indicates the continuous 24-hour trading of silver in the worldwide forex markets.
In 2000, the daily silver price fix data showed that prices ranged from $4.93 oz to $5.02 oz in June and July, and gradually decreased from August to December, ranging from $4.76 oz to $4.58 oz.
This data suggests that global demand for silver during this period may have been influenced by various economic and political factors.
The fluctuations in silver prices during 2000 may have been due to changes in the global demand for silver.
Silver has various industrial applications, such as in the production of electronic devices, solar panels, and medical equipment.
Therefore, the demand for silver may have been affected by changes in the global economy and geopolitical events.
Understanding historical silver market trends can provide valuable insights into the factors that influence the demand and price of silver, which can inform investment decisions and contribute to the development of sustainable economic policies.
US Federal Budget Proposals
President Clinton proposed federal budget measures for fiscal year 2001 that included plans for reducing national liabilities, tax cuts for low-income households, and increased healthcare expenditures while utilizing accounting tactics to create a façade of sound financial management.
The budget proposals aimed to pay down the national debt, which was a pressing concern at the time. However, the government used cash accounting gimmicks to give the impression that federal government liabilities were a non-issue.
In addition to reducing national debt, the budget proposals also attempted to address issues related to healthcare spending. The proposals included increased spending on healthcare, which was intended to improve access to healthcare for Americans.
While these measures were commendable, the government’s use of cash accounting gimmicks to create the illusion of sound financial management ultimately undermined the effectiveness of these measures.
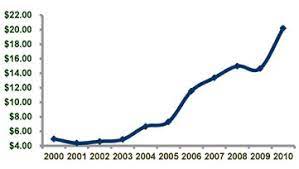
Despite these efforts, the current state of the federal budget now stands at more than twice what it was in 2000, with total federal debt almost four times higher than it was at the turn of the millennium.
Impact on Real Wages
Real median income for US households has stagnated since 2000 despite increases in government spending and debt levels. This stagnation has been a cause for concern, especially as inflation has eroded the purchasing power of households. Inflation effects have been particularly pronounced in the cost of healthcare, education, and housing, which have all increased at rates higher than the average inflation rate.
The persistence of real wage stagnation has contributed to rising income inequality in the US, with the top earners seeing significant increases in their income. This has led to a growing sense of frustration and anger among the middle and lower-income households, who feel left behind by the economic system.
The lack of progress in addressing real wage stagnation has also contributed to a decline in trust in government institutions and a rise in populism.
Frequently Asked Questions
What factors contributed to the fluctuation in silver prices in 2000?
Silver prices in 2000 were influenced by multiple factors, including silver mining and industrial demand, as well as investor sentiment and geopolitical tensions. These factors impacted the supply and demand dynamics, leading to fluctuations in the silver prices.
How did the global forex market impact silver prices in 2000?
The global forex market impacted silver prices in 2000 by influencing the supply and demand dynamics of the metal. Silver demand drivers such as industrial uses, jewelry, and investment demand were affected by fluctuations in currency exchange rates.
What is the significance of the LBMA silver price fix history data?
The LBMA silver market is significant because it provides a benchmark for silver prices through the daily silver price fix. However, there has been controversy over allegations of price fixing by various trading banks and brokerages involved in the over-the-counter silver bullion markets.
How has the purchasing power of silver changed since 2000?
The purchasing power of silver has fluctuated since 2000 due to inflation impact. Silver as an investment has shown potential for asset preservation and prudent allocation purposes, but using online information for speculative purposes is not advised.
What are some potential long-term effects of the US federal debt on silver prices?
Long-term implications of US federal debt on silver prices depend on monetary policy. High debt levels may lead to inflation and weaken the US dollar, increasing demand for silver as a hedge against currency devaluation.