Silver prices in 2012 witnessed a rollercoaster ride, seeing spot prices soaring to the highest point of $34.71 per ounce on September 14th. All kinds of silverware, from jewelry to coins and even bars, felt the impacts of this volatility.
By December 27th, prices had plummeted to the lowest point of $29.75 per ounce. This drastic fluctuation in prices has sparked debates and discussions among experts, traders, and investors, urging them to forecast the underlying factors responsible for such volatility in the precious metals market.
The year 2012 was significant for the silver market, as it not only saw price fluctuations but also allegations of price manipulation in the industry. Whether you collected coins or jewelry, suspicion colored the market. This article aims to provide an in-depth analysis of the factors that contributed to these price movements and the allegations of price manipulation.
It is important to note that the focus of this article is on presenting objective and data-driven information, and readers should be aware of the limitations and potential inaccuracies of historical price data. Whether you’re an adult considering investing in bars of silver or just interested in the current spot price, the information here should be approached with prudent thought.
Price Information
The website provides a wealth of information on historical and current silver prices. Daily silver price data is available from 1968 to 2021, allowing for a detailed analysis of historical trends. The LBMA Silver Price Auction is also available, which represents composite prices arrived at by various trading banks and brokerages in the over-the-counter silver bullion markets.
In addition, the website provides information on forex silver market prices, which trade continuously 24 hours a day. These forex prices most frequently quoted in the precious metals industry are an important ingredient in the formula that makes up the spot price of silver.
When analyzing silver prices, the market factors that impact them also need consideration. Various precious metal experts have alleged ongoing price manipulation, and high-profile cases of precious metal fraud have come to light. The website gives crucial information on composite silver fix prices, determined by trading banks and brokerages.
While the website can’t guarantee the accuracy of the displayed price data, it provides a valuable resource for adults looking to track historical silver prices or stay up-to-date on current market factors that might affect their silverware value.
Manipulation Allegations
Allegations of price manipulation in the precious metals industry have been a longstanding concern among experts, with some pointing to evidence of fraudulent activity. In late 2018, the US Department of Justice arrested a former long-time precious metal derivative trader from JP Morgan Chase for precious metal fraud. While this arrest brought attention to ongoing allegations of price manipulation, the COMEX regulating CFTC failed to find enough evidence to prosecute long-standing claims of price manipulation.
The lack of concrete action against suspected price manipulation has affected market perception. Investors may question the fairness and transparency of the precious metals market, which could impact demand and prices.
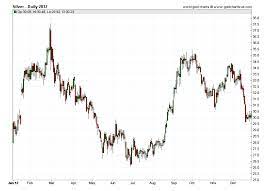
2012 Price Chart
Investors may refer to the 2012 chart to gain insight into historical trends and use that information to forecast their purchasing decisions of physical precious metal bullion products.
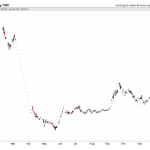
The chart displays daily silver prices from July 31 to December 31, 2012. Prices peaked on September 14, 2012, at $34.71 per ounce, and hit a low of $29.75 per ounce on December 27, 2012.
Price trends in 2012 were influenced by various market factors such as supply and demand, geopolitical tensions, and currency fluctuations. The global economic slowdown, particularly in Europe, led to lower demand for silver in industrial applications, which contributed to the decline in prices.
Additionally, the US dollar’s strength against other major currencies also affected the price trend, as a stronger dollar makes precious metals less attractive to investors.
The 2012 chart provides valuable information for investors to analyze historical price trends and make informed decisions about purchasing precious metals for asset preservation and allocation purposes.
Frequently Asked Questions
What factors contributed to the fluctuation of silver prices in 2012?
The fluctuation of silver prices in 2012 can be attributed to supply demand dynamics and investor sentiment. Factors such as global economic uncertainty, fluctuations in the US dollar, and changes in industrial demand impacted silver prices.
How do geopolitical events affect the silver market?
Geopolitical events can impact the silver market through political instability and changes in supply and demand dynamics. For instance, trade tensions, economic sanctions, and political unrest can lead to fluctuations in silver prices due to changes in demand and supply levels.
What is the relationship between the silver market and the global economy?
The silver market is influenced by global economic factors, including silver demand and inflation impact. The metal is used in various industries, making demand a significant factor, while inflation can affect the value of currency and, in turn, silver prices.
What is the long-term outlook for silver prices?
Silver market predictions suggest that the long-term outlook for silver prices is positive due to increasing demand in various industries such as electronics and renewable energy. Investment strategies should consider silver’s volatility and the potential for price manipulation.
How can investors take advantage of silver market trends?
Investment strategies in the silver market can be informed by market analysis, such as monitoring the LBMA Silver Price Auction and forex silver markets. Objectivity and analytical rigor are essential for prudent allocation purposes and avoiding speculative use of price data.